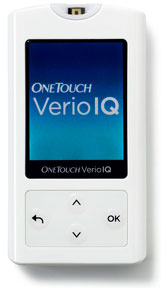
The OneTouch VerioIQ was touted as “the first meter ever that automatically alerts you to patterns you might not even know were there.” It joined other “smart” meters like the Telcare Blood Glucose Meter.

The Meter
Using the Verio test strips, the VerioIQ is a white meter with a color LCD screen. It has a strip port light and automatic backlight for testing in the dark. There are 4 buttons on its face for scrolling and navigating through the software. It includes a rechargeable battery that can be charged through an AC adaptor or a mini USB cable (both provided). The meter keeps 750 results in its memory, allowing you to display 7, 14, 30 and 90-day blood glucose averages as well as up to 50 pattern messages. As far as accuracy, they say that their Smartscan technology scans blood samples 500 times to correct for common “interferences.”
This meter’s main feature is PatternAlert, which looks at all the readings in the meter memory and alerts you when it finds a concerning pattern. It then gives you advice on how to resolve the problem using their Test Smart Pattern Guide, a separately requested (and paper) booklet. The presets are 130 mg/dl for highs and 70 mg/dl but they can be personalized. These presets can be personalized in the meter. Using these presets, the meter looks for:
High Glucose Pattern: 3 before meal Highs within the same 3-hour window over the past 5 days.
Low Glucose Pattern: 2 lows within the same 3-hour window over the past 5 days
When a pattern is recognized, the meter will alert you with a message explaining the pattern and allow you to view each test result in the pattern. Their Pattern Guide offers possible causes and potential solutions but you should consult your physician before making changes. Pattern recognition is a big part of good diabetes management and having a meter that does it for you makes it much easier.
Software
The meter uses the OneTouch Diabetes Management Software to download results to a computer (PC-only) using a provided mini-USB cable. The software does all the math for you, allowing you to see a complete picture of your results in 10 different reports:
- Logbook – Review glucose results and the important factors that affect them, with out-of-range results highlighted. Shows averages by time slot.
- 14-day Summary – Shows at-a-glance views of three popular reports: Logbook, Pie Chart, and Glucose Trend.
- Glucose Trend – Identify blood glucose highs and lows.
- Pie Chart – Reveals pre-meal and post-meal readings that fall in and out of range.
- Average Reading – Quick view of trends by meal and day of the week.
- Standard Day – Spot patterns in blood glucose results by the time of day.
- Data List – Provides a complete day-by-day record of blood glucose results in chronological order.
- Histogram – Helps you quickly and accurately identify the frequency that readings fall within a certain range.
- Insulin – Shows the impact of insulin and carbohydrate intake on glucose levels.
- Health Checks – View important health-related factors such as blood pressure, weight, doctor’s visits, and A1c.
